
Monitor Your VPS — Uptime Alerts, Resource Graphs and Disk Warnings
Most VPS problems warn you before they become an outage: the disk fills over weeks, memory creeps up after each deploy, a certificate quietly stops renewing. Without monitoring, the first warning is a customer saying the site is down.
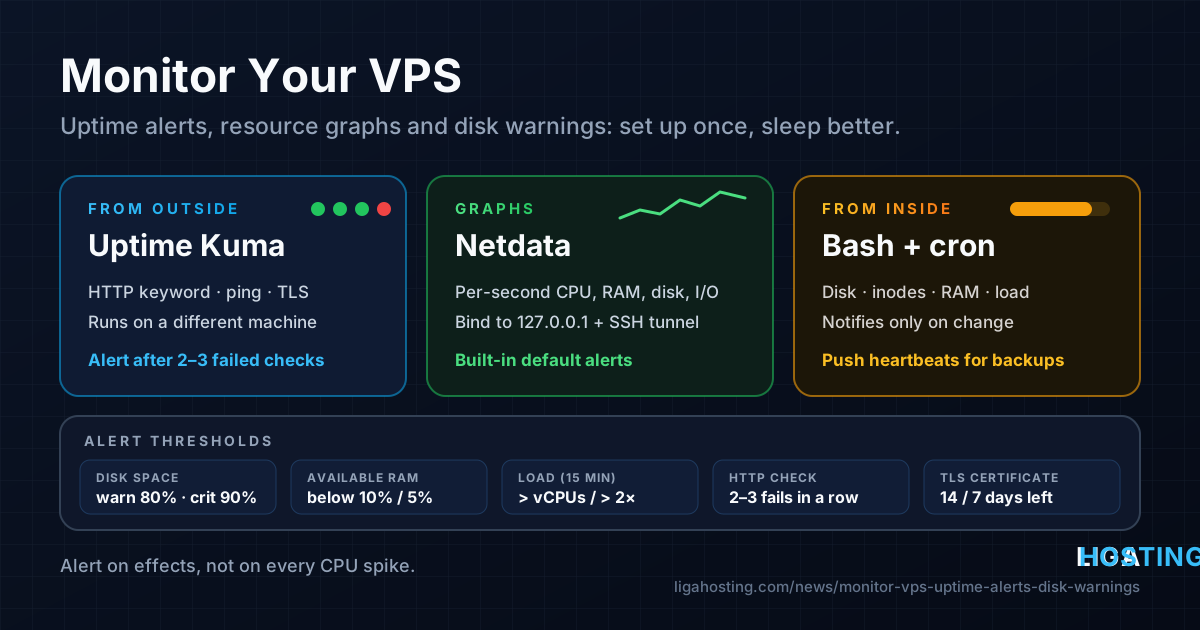
This guide builds a small, realistic monitoring setup for one or a few servers: external uptime checks that tell you when the site is unreachable, resource graphs that show you why, and simple alerts for disk, memory and load. Everything here is free and runs on Ubuntu, Debian and AlmaLinux. For what uptime percentages mean, see What 99.9% Uptime Really Means; this article is about catching problems on your own server.
Three layers: from outside, from inside, and heartbeats
A useful setup answers three different questions, and no single tool answers all of them well:
- External checks — can visitors reach the site, and does it return the right page? Here: Uptime Kuma on a different machine.
- Internal metrics — what is the server doing with CPU, RAM, disk and services? Here: Netdata, or a small script with cron.
- Heartbeats — did the backup or the cron job actually run? Here: push monitors in Uptime Kuma.
The most important rule: a server cannot report its own death. If the VPS is frozen or has lost its network, any monitor running on it goes silent too. External checks must run somewhere else — a second small VPS in another location, or a machine at home or in the office.
Thresholds that are worth an alert
Alerting on everything is as bad as alerting on nothing: after a week of noise you ignore the messages. Start with this list:
| Metric | Warning | Critical | Why it matters |
|---|---|---|---|
| Disk space used | 80% | 90% | A full disk breaks databases, logs and updates |
| Inodes used | 80% | 90% | Many small files (sessions, cache) run out before space |
| Available RAM | below 10% | below 5% | Next comes swapping or the OOM killer |
| Load average (15 min) | above vCPU count | above 2× vCPUs | Work is queuing; short spikes are normal |
| HTTP check | — | 2–3 failures in a row | One failure is often a network blip |
| TLS certificate | 14 days left | 7 days left | Renewal runs much earlier, so it has failed |
| Backup heartbeat | — | missing 26 hours | The daily job did not run |
| Failed systemd units | any | — | A service crashed and stayed down |
CPU usage itself is usually not worth an alert: 100% for a few minutes during a build is the VPS doing its job. Alert on the effects — failing HTTP checks and a sustained high load.
Uptime Kuma — external checks with alerts
Uptime Kuma is a self-hosted monitoring tool with a web interface. It checks websites, TCP ports, ping, DNS and certificates, and sends alerts to email, Telegram, Discord, Slack, ntfy and many other services. Install it on a machine that is not the server you are watching. The easiest way is Docker Compose:
mkdir -p ~/uptime-kuma && cd ~/uptime-kuma
cat > compose.yaml <<'EOF'
services:
  uptime-kuma:
    image: louislam/uptime-kuma:2
    container_name: uptime-kuma
    restart: unless-stopped
    ports:
      - "127.0.0.1:3001:3001"
    volumes:
      - ./data:/app/data
EOF
docker compose up -d
docker compose logs --tail 20
The port is bound to 127.0.0.1 on purpose, so the dashboard is not open to the internet. Reach it through an SSH tunnel (ssh -L 3001:127.0.0.1:3001 user@203.0.113.10, then http://localhost:3001) or put it behind Nginx with HTTPS as status.example.com. Create the admin account on the first visit — immediately.
Good first monitors:
- HTTP(s) – Keyword for your main page, with a word that only appears when the page works. A plain HTTP check also passes on an error page served with status 200.
- Heartbeat interval 60 seconds and Retries 2, so Kuma alerts after about three minutes of real failure.
- Certificate expiry notification enabled on the HTTPS monitors.
- Ping to the server IP. If ping works but HTTP fails, the web stack is the problem; if both fail, look at the server or the network.
Then add a notification under Settings → Notifications, tick Default enabled so new monitors use it, and press Test. An untested alert channel is not an alert channel.
Heartbeats for backups and cron jobs
A Push monitor works the other way around: Kuma waits for your job to call a URL and alerts when the call is late. For a daily backup, set the heartbeat interval to 93600 seconds (26 hours) and call the push URL only when the job succeeded:
/usr/local/bin/backup.sh && \
  curl -fsS -m 10 "https://status.example.com/api/push/AbC123xyz?status=up&msg=OK" > /dev/null
This catches what no other monitor sees: a backup script that broke after an update or a cron entry removed by mistake.
Netdata — live resource graphs
When an alert fires, you need to see what happened. Netdata collects metrics every second (CPU, RAM, disk I/O, network, processes, Nginx, MySQL, Docker), shows them as graphs and ships with sensible default alerts. The official script works on Ubuntu, Debian and AlmaLinux:
wget -O /tmp/netdata-kickstart.sh https://get.netdata.cloud/kickstart.sh
sh /tmp/netdata-kickstart.sh --stable-channel --disable-telemetry
systemctl status netdata --no-pager
Connecting to Netdata Cloud is optional; the local dashboard works without it. Netdata listens on port 19999 — limit it to localhost:
cd /etc/netdata
sudo ./edit-config netdata.conf
# in the [web] section set:
#   bind to = 127.0.0.1
sudo systemctl restart netdata
sudo ss -ltnp | grep 19999   # should show 127.0.0.1:19999 only
Open the dashboard through an SSH tunnel: ssh -L 19999:127.0.0.1:19999 user@203.0.113.10, then browse to http://localhost:19999.
To receive Netdata's alerts, run sudo ./edit-config health_alarm_notify.conf in /etc/netdata and fill in one method, for example SEND_TELEGRAM="YES" with TELEGRAM_BOT_TOKEN and DEFAULT_RECIPIENT_TELEGRAM (email needs a working local mail transport). To change a threshold, edit the warn and crit lines in health.d/disks.conf the same way and apply with sudo netdatacli reload-health. Netdata uses some RAM and CPU itself; if you only need alerts, the script below is lighter.
A small alert script for disk, RAM, load and services
Without extra software, a short Bash script and cron cover the internal checks. It sends a message only when the state changes (new problem or all clear), using ntfy push notifications. Pick a long random topic name: anyone who knows it can read it.
sudo tee /usr/local/bin/vps-check.sh > /dev/null <<'EOF'
#!/usr/bin/env bash
set -u
NTFY_URL="https://ntfy.sh/replace-with-a-long-random-topic"
STATE=/var/tmp/vps-check.state
DISK_WARN=80   # percent used
MEM_WARN=10    # percent available
host=$(hostname)
problems=""

# Disk space and inodes on real filesystems
while read -r sp ino mnt; do
  sp=${sp%\%}; ino=${ino%\%}
  [[ $sp =~ ^[0-9]+$ ]] && [ "$sp" -ge "$DISK_WARN" ] && problems+="disk $mnt ${sp}% used\n"
  [[ $ino =~ ^[0-9]+$ ]] && [ "$ino" -ge "$DISK_WARN" ] && problems+="inodes $mnt ${ino}% used\n"
done < <(df --output=pcent,ipcent,target -x tmpfs -x devtmpfs -x overlay -x squashfs | tail -n +2)

# Available memory
mem=$(awk '/MemTotal/{t=$2} /MemAvailable/{a=$2} END{printf "%d", a*100/t}' /proc/meminfo)
[ "$mem" -lt "$MEM_WARN" ] && problems+="RAM only ${mem}% available\n"

# 15-minute load average above the number of vCPUs
cpus=$(nproc)
if awk -v n="$cpus" '{exit !($3 > n)}' /proc/loadavg; then
  problems+="load $(cut -d' ' -f3 /proc/loadavg) on $cpus vCPU\n"
fi

# Crashed services
failed=$(systemctl --failed --no-legend --plain | awk '{print $1}' | tr '\n' ' ')
[ -n "$failed" ] && problems+="failed units: $failed\n"

msg=$(printf "%b" "$problems")
old=$(cat "$STATE" 2>/dev/null || true)
[ "$msg" = "$old" ] && exit 0
if [ -n "$msg" ]; then
  curl -fsS -m 10 -H "Title: $host: problem" -H "Priority: high" -d "$msg" "$NTFY_URL" > /dev/null
else
  curl -fsS -m 10 -H "Title: $host: all clear" -d "All checks OK" "$NTFY_URL" > /dev/null
fi && printf "%s" "$msg" > "$STATE"
EOF
sudo chmod 755 /usr/local/bin/vps-check.sh
sudo /usr/local/bin/vps-check.sh; echo "exit code $?"
The state file is only updated when the notification was delivered, so a failed send is retried on the next run. Schedule it every five minutes:
echo '*/5 * * * * root /usr/local/bin/vps-check.sh' | sudo tee /etc/cron.d/vps-checkOn minimal AlmaLinux images install cron first: sudo dnf install -y cronie && sudo systemctl enable --now crond.
When the disk warning fires
Disk alerts are the ones you will see most often. Find out what grew, in this order:
df -h; df -i                  # which filesystem, space or inodes?
sudo du -xh --max-depth=2 / 2>/dev/null | sort -h | tail -20
journalctl --disk-usage       # systemd journal size
docker system df              # if you use Docker
sudo lsof +L1 # deleted files still held open- Logs. Cap the journal with
SystemMaxUse=500Min/etc/systemd/journald.conf, thensudo systemctl restart systemd-journald, and make sure app logs are inlogrotate. More in Linux Logs for VPS Owners. - Docker. Old images and build cache add up:
docker image prune -aanddocker builder prune. - Local backups. Keep only a few archives on the server and send the rest elsewhere.
- Deleted but open files. If
dfsays full butdufinds nothing, restart the service thatlsof +L1shows.
If the data is simply growing, plan before 90%: a larger plan in the same VPS line is a self-service upgrade from the client area.
Test your alerts, then know who fixes what
A setup is finished only when you have seen each alert arrive. Outside busy hours, create a large file with sudo fallocate -l 5G /root/alert-test.img (pick a size that crosses 80%), wait for the alert and delete it; then stop Nginx for three minutes and watch Uptime Kuma. Check that the "recovered" message arrives too and that each alert names the server.
Liga Hosting VPS are unmanaged: the operating system and its services are yours to fix. If ping and every external check fail together while nothing in your own changes explains it, contact support with the times from your monitor — network, hardware and IP issues are what we handle.
Frequently Asked Questions
Can I run Uptime Kuma on the same VPS I am monitoring?
You can, but it will not tell you when that VPS goes down, because it goes down with it. Run it on a second machine, ideally in another location.
Is Netdata too heavy for a small VPS?
On a 2 GB VPS it usually runs fine, but it does use memory and some CPU. If you mostly need alerts, the cron script uses almost nothing.
Why alert on available RAM instead of used RAM?
Linux uses free memory for file cache, so "used" memory is often high on a healthy server. MemAvailable counts reclaimable cache, so it is the number that predicts out-of-memory problems.
Which notification channel is best?
The one you will notice at night. Push (ntfy, Telegram) is fast; email is fine for warnings. Keep the critical channel quiet so every message means something.
At Liga Hosting, our Standard VPS and Performance VPS plans come with full root access, NVMe storage and DDoS protection, so you can run Uptime Kuma, Netdata or your own scripts as described here. A small VPS in a second location makes a good external monitor — and if your checks point to the network, contact us with the times.