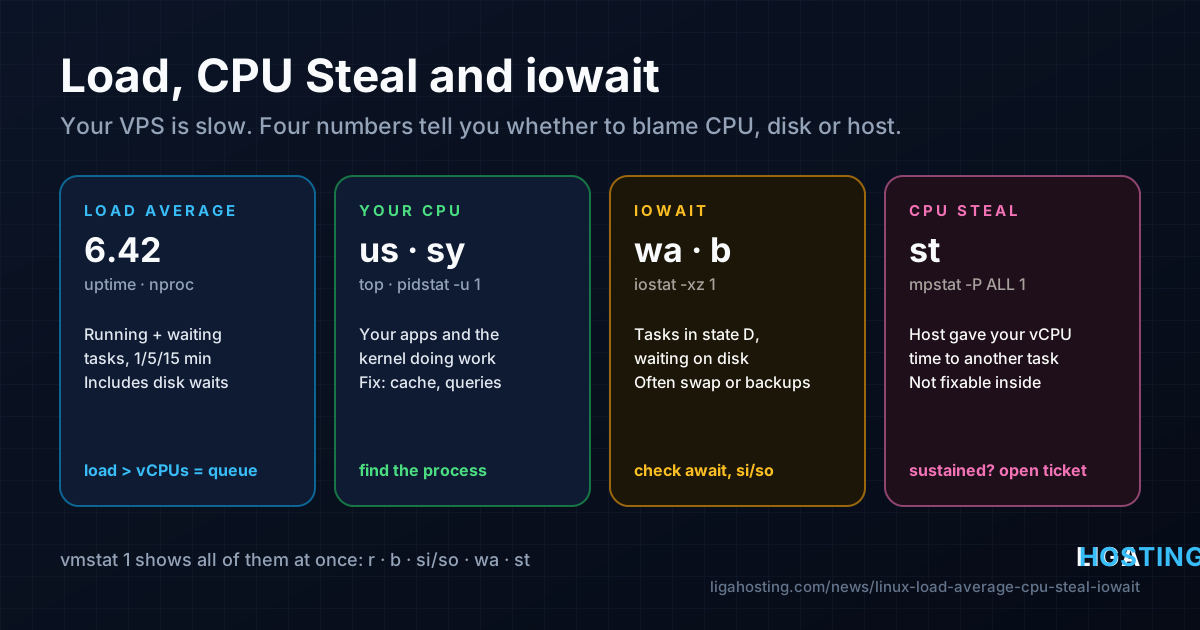
Load Average, CPU Steal and iowait — How to Read a Slow VPS
Your site feels slow, you log in to the VPS, run top and see a load average of 6.42. Is that bad? Is the CPU too small, the disk slow, or something else eating resources? The numbers are on the screen, but they are easy to misread.
This guide explains what load average, iowait and CPU steal measure on Linux and how to go from "the server is slow" to a specific cause in a few minutes. Commands work on current Ubuntu and Debian; AlmaLinux differences are noted.
What load average actually measures
The three numbers shown by uptime and top are the average number of tasks that wanted to run over the last 1, 5 and 15 minutes. On Linux, that count includes two kinds of tasks:
- Runnable tasks (state R) — running on a CPU or waiting in line for one.
- Uninterruptible tasks (state D) — usually waiting for disk I/O, sometimes for a network filesystem or a kernel lock.
So on Linux a high load does not necessarily mean a busy CPU: twenty processes waiting for a slow disk produce a load of about 20 while the CPU sits idle.
Load average is also not a percentage. It only means something compared with the number of vCPUs:
nproc            # number of vCPUs, e.g. 4
uptime           # ... load average: 6.42, 3.10, 1.85
cat /proc/loadavg| Load compared with vCPUs | What it usually means |
|---|---|
| Below the vCPU count | There is spare capacity; tasks rarely wait |
| Around the vCPU count | Fully used, but not yet queuing much |
| Clearly above it for minutes | Tasks are waiting — for CPU or for I/O; find out which |
| 1-minute value far above 15-minute value | A recent spike (cron job, backup, traffic burst) |
Here, 6.42 on 4 vCPUs and rising means work is queuing now. Next, find out what it waits for.
Step 1 — Read the CPU line in top
Run top and look at the line starting with %Cpu(s). Press 1 to see each vCPU separately, and q to quit.
%Cpu(s): 62.0 us, 9.3 sy, 0.0 ni, 12.1 id, 14.8 wa, 0.0 hi, 0.4 si, 1.4 st| Field | Meaning | When it is high |
|---|---|---|
us | User space: your applications (PHP, Node.js, MySQL, Python) | Your code is doing heavy work |
sy | Kernel work for those applications (system calls, networking, file handling) | Many connections, many small files, or a busy firewall |
id | Idle | Spare CPU |
wa | iowait: CPU idle while tasks wait for disk I/O | The disk, not the CPU, is the bottleneck |
st | steal: time your vCPU wanted to run but the host gave it to something else | The physical CPU is contended |
A useful rule: us + sy tells you how much CPU your own software uses, wa points at storage, and st points at the virtualisation layer below your VPS.
Step 2 — Watch everything at once with vmstat
top shows a snapshot; vmstat (installed by default) prints one line per second, so trends are obvious.
vmstat 1 10procs -----------memory---------- ---swap-- -----io---- -system-- ------cpu-----
r b swpd free buff cache si so bi bo in cs us sy id wa st
5 0 0 412300 61200 2210400 0 0 12 340 2100 4300 81 12 6 0 1
1 7 0 398100 61200 2215800 0 0 9800 4200 1900 3100 10 4 40 46 0The columns that matter most for this guide:
- r — tasks running or waiting for a CPU. Consistently higher than
nprocmeans CPU saturation. - b — tasks blocked in uninterruptible sleep, usually on I/O. These count towards load average without using CPU.
- si / so — memory swapped in and out per second. Anything other than occasional small numbers means RAM is short.
In the first line above, r is high and us is 81%: the CPU is the bottleneck. In the second line, b is 7 and wa is 46%: processes are waiting on disk, and adding vCPUs would not help.
High load, idle CPU: tracking down iowait
When wa and b are high, find out which device and which processes are involved. Install the sysstat package, which provides iostat, pidstat, mpstat and sar:
# Ubuntu / Debian
sudo apt install -y sysstat

# AlmaLinux
sudo dnf install -y sysstat
Then look at the disks, refreshed every second:
iostat -xz 1 5- r_await / w_await — average milliseconds per read or write, including queue time. On NVMe these are normally low single digits; sustained tens or hundreds mean requests are queuing.
- aqu-sz — average number of requests waiting; steadily growing values confirm a backlog.
Next, find the processes responsible:
# Processes currently in uninterruptible sleep (state D)
ps -eo stat,pid,user,comm | awk '$1 ~ /^D/'

# Disk reads and writes per process, every second
sudo pidstat -d 1 5
Typical culprits are backups, rsync, or a database scanning large tables. For MySQL or MariaDB in state D, the fix is usually a bigger buffer pool or better indexes, not a faster disk. Run backups at night with low priority:
# Run a backup with the lowest CPU and I/O priority
nice -n 19 ionice -c3 /usr/local/bin/backup.sh
When iowait is really a memory problem
A server short on RAM looks like a server with a slow disk: the kernel swaps and drops the file cache, so programs read from disk instead of memory. Check:
free -h
vmstat 1 5          # look at si / so
sudo dmesg -T | grep -Ei 'out of memory|oom' | tail
If si/so are non-zero every second and available memory is low, the root cause is memory, not storage: reduce PHP-FPM workers, lower database buffers, or add RAM. Our guide on the OOM killer and swap covers this in detail.
CPU steal: when the host is the bottleneck
Every VPS runs on a physical server shared with other virtual machines. With KVM, each vCPU is a thread on the host. When your vCPU is ready to run but the host scheduler gives the physical core to another task, the guest kernel records that time as steal (st).
Measure it per vCPU:
mpstat -P ALL 1 5        # %steal column
vmstat 1 30 # st column- 0–2% most of the time — normal on any virtual machine.
- Short spikes of a few seconds — usually harmless.
- Clearly high for minutes or hours, with slow responses while your own
us+syis moderate — your VPS is not getting the CPU time it should.
Steal cannot be fixed from inside the VPS. Collect evidence and open a ticket: the time range, the output of mpstat -P ALL 1 30 or sar -u (see below), and a note that your own load is normal. Support can then check the physical node.
High us or sy: finding the process that burns CPU
When us + sy is high and r is above the vCPU count, the CPU really is busy. Find out who uses it:
# Top 10 processes by CPU right now
ps -eo pid,user,%cpu,%mem,etime,cmd --sort=-%cpu | head -n 11

# CPU per process, averaged every second (more accurate than ps)
pidstat -u 1 5
What you typically find, and what to do:
- Many
php-fpmprocesses — dynamic pages generated for every request. Add page caching and an opcode cache; check that bots are not crawling expensive URLs. mysqldormariadbdat the top — slow queries. Enable the slow query log and add the missing indexes.- An unknown process with a random name using all cores — possibly a cryptominer after a compromise. Check its path with
ls -l /proc/PID/exe, and treat the server as compromised if it is not yours. - A single process at exactly 100% on a multi-core VPS — a single-threaded workload. More vCPUs will not help it; a faster core will.
Keep a history with sar
Slowness often happens at 3 a.m. and is gone by the time you log in. The sar collector from sysstat records CPU, load, memory and disk statistics every 10 minutes, so you can look back.
# Ubuntu / Debian: enable collection
sudo sed -i 's/^ENABLED="false"/ENABLED="true"/' /etc/default/sysstat
sudo systemctl enable --now sysstat

# AlmaLinux: collection runs once the service is enabled
sudo systemctl enable --now sysstat
After it has collected some samples:
sar -u          # CPU split for today, including %iowait and %steal
sar -q          # run queue and load averages
sar -r          # memory use
sar -d -p       # per-disk activity with device names

# A previous day: the file name is the day of the month
sar -u -f /var/log/sysstat/sa12     # Ubuntu / Debian
sar -u -f /var/log/sa/sa12          # AlmaLinux
A few weeks of history shows whether a problem is new, getting worse or tied to a fixed time such as a cron job. For alerts and graphs, see our guide to monitoring a VPS.
Quick decision table
| What you see | Likely cause | First action |
|---|---|---|
High load, high us, r above vCPUs | Application needs more CPU than available | Find the process, add caching, optimise queries; then more vCPUs |
| One process at 100%, others idle | Single-threaded workload | Faster cores help more than more cores |
High load, high wa, high b, low us | Waiting on disk I/O | iostat -xz, pidstat -d; move backups, fix database queries |
si/so non-zero, low available memory | RAM shortage causing swapping | Reduce workers and buffers or add RAM |
High st for long periods, own usage moderate | Contention on the host | Collect sar -u / mpstat output and contact support |
Optimise or upgrade?
Upgrade only once you know which resource is short: more vCPUs for parallel work queuing on CPU, more RAM for swapping or a starved database cache, a faster core for single-threaded work.
On Liga Hosting, the Standard VPS line runs on AMD EPYC 7702 (Frankfurt) and dual Intel Xeon Gold 6254 (Tulcea) with more cores and RAM per euro; the Performance VPS line in Frankfurt runs on AMD Ryzen 9 9950X with much higher clock speed. See Standard vs Performance VPS for which fits your workload. Upgrades within a line are prorated and done from the client area; moving between lines is done by support via a ticket.
Frequently Asked Questions
What is a good load average for my VPS?
There is no single number. Compare it with nproc: a load at or below the number of vCPUs means tasks rarely wait. A load clearly above it for several minutes means work is queuing, and you should check whether it is waiting for CPU or for disk.
Why is my load high when the CPU is mostly idle?
Linux includes tasks waiting for disk I/O (state D) in the load average. High load with high wa and a high b column in vmstat means processes are waiting for storage or are swapping because memory is short, not that the CPU is too small.
How much CPU steal is normal on a VPS?
A few percent, with occasional short spikes, is normal on any virtual machine. Steal that stays clearly high for long periods while your own CPU use is moderate means your VPS is not getting the CPU time it should; record it with sar -u or mpstat and contact support.
Does high iowait mean my disk is broken?
Usually not. Most often it is a backup, a database query reading a lot of data, or memory pressure forcing the system to read from disk. Check iostat -xz and pidstat -d to find the process before suspecting the hardware.
Will more vCPUs fix a slow website?
Only if the CPU is the bottleneck and the work runs in parallel. If the problem is iowait, swapping or a single-threaded process at 100%, more vCPUs will not change much. Measure first with vmstat, then upgrade the resource that is actually short.
At Liga Hosting, every Standard VPS and Performance VPS runs on KVM with NVMe storage, DDoS protection and full root access, so you can install sysstat and see exactly where your server spends its time. Daily billing lets you test a bigger plan with your real workload before committing. If you see sustained CPU steal, contact us with your measurements.