
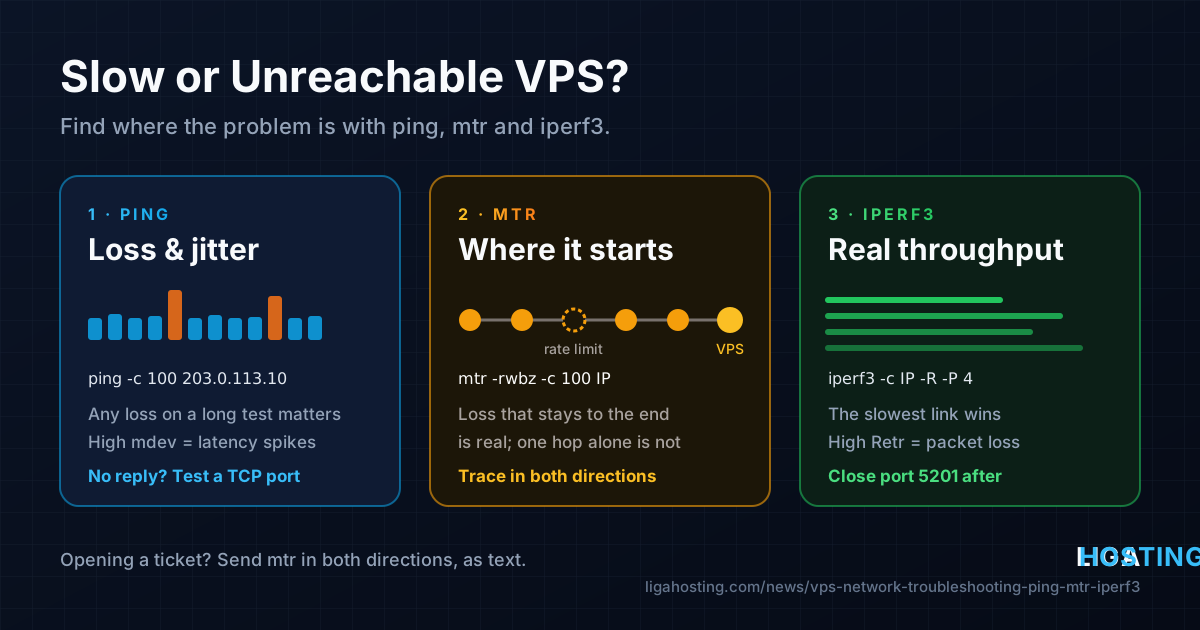
Slow or Unreachable VPS? Diagnose Network Problems with ping, mtr and iperf3
Your SSH session freezes for a second every few minutes, a download from the server crawls, or customers in one country say the site "does not load" while it works fine for you. It is tempting to blame "the network", but the network has many parts: your home connection, your provider, several transit networks, the data centre and the VPS itself.
This guide shows how to narrow the problem down with four standard tools — ping, mtr, curl and iperf3. You will learn how to read their output without falling for the most common false alarms, and what to collect before you open a ticket, so the problem can be fixed on the first reply instead of the fifth.
First: is it really the network?
Many "network" problems are a busy server. If the CPU is saturated, memory is swapping or the disk is full, SSH lags and pages load slowly, even though every packet arrives on time. Spend one minute on the VPS before you test the path:
uptime                      # load average vs number of vCPUs (nproc)
free -h                     # is swap being used heavily?
df -h /                     # a full disk breaks almost everything
top -o %CPU                 # what is using the CPU right now (q to quit)
A quick way to tell the two apart: if ping to the server is steady and low while the site is slow, the delay is inside the server (web server, PHP, database). If ping itself shows high or jumping latency, or lost replies, keep reading.
Install the tools
All of these are in the standard repositories. Install them on the VPS, and also on a Linux or macOS machine on your side if you can:
# Ubuntu / Debian
sudo apt update
sudo apt install -y mtr-tiny iperf3 traceroute dnsutils

# AlmaLinux / Rocky
sudo dnf install -y mtr iperf3 traceroute bind-utils
On Ubuntu and Debian the iperf3 package asks whether to start iperf3 as a daemon. Answer No — you only want it running while you test. On macOS, brew install mtr iperf3 installs both. On Windows, use pathping (built in) or WinMTR, and iperf3 builds for Windows.
Step 1 — ping: is there loss or jitter?
ping sends small ICMP packets and measures the round trip. Run it for long enough to see a pattern — a handful of packets proves nothing:
# From your computer to the VPS, 100 packets
ping -c 100 203.0.113.10

# Force IPv4 or IPv6 when a domain has both
ping -4 -c 100 example.com
ping -6 -c 100 example.com
Look at the summary at the end:
100 packets transmitted, 100 received, 0% packet loss, time 99140ms
rtt min/avg/max/mdev = 21.402/22.118/31.877/1.204 ms- packet loss — anything above 0% on a long test is worth investigating; a few percent is enough to make SSH feel sticky and TCP downloads slow.
- avg — mostly a matter of distance. Within Europe, a few to a few dozen milliseconds is normal; across an ocean, 80–200 ms is normal and no setting will remove it.
- max and mdev — the jitter. A low average with a high max and large mdev means latency spikes, which hurt interactive work and calls more than a steady higher latency.
If ping gets no answer at all but the site loads, ICMP is probably blocked by a firewall on the server or along the way. That is not an outage. Test a real port instead: nc -vz 203.0.113.10 443 or nc -vz 203.0.113.10 22.
Step 2 — mtr: where does the problem start?
mtr combines traceroute and ping: it lists every router (hop) between you and the target and keeps measuring loss and latency for each one. This is the single most useful report for a network problem.
# Report mode, 100 cycles, show names and IPs, show AS numbers
mtr -rwbz -c 100 203.0.113.10

# Same over TCP port 443, for paths that filter ICMP (needs root)
sudo mtr -rwbz -T -P 443 -c 100 example.com
The output looks like this (shortened):
HOST                                   Loss%   Snt   Last   Avg  Best  Wrst StDev
 1. AS???  192.168.1.1                  0.0%   100    0.6   0.7   0.5   2.1   0.2
 2. AS64500 isp-gw.example.net          0.0%   100    7.9   8.4   7.1  19.3   1.6
 3. AS64500 core1.example.net          40.0%   100    9.1   9.0   8.6  10.2   0.3
 4. AS64501 transit.example.org         0.0%   100   18.2  18.6  17.9  24.0   0.9
 5. AS64502 edge.example.com            0.0%   100   21.7  22.0  21.3  26.8   0.7
 6. AS64502 203.0.113.10                0.0%   100   21.9  22.1  21.4  27.2   0.8
How to read it without false alarms
- Loss on a middle hop that does not continue is not a problem. In the example, hop 3 shows 40% loss, but hops 4, 5 and 6 show 0%. Routers forward traffic in hardware but answer probes with their slow control plane and rate-limit those replies. Only the loss that carries through to the last hop affects your traffic.
- Real loss starts at a hop and stays until the end. If hop 4 shows 8% and every hop after it, including the destination, shows around 8%, the problem is at or just before hop 4.
- Latency works the same way. A single hop with a high average followed by normal hops is just a slow reply. A jump that stays for all following hops (for example from 20 ms to 140 ms) shows where the traffic takes a long or congested path.
- Hops with "???" simply do not answer probes. They are normal unless the trace stops there and never reaches the target.
- The AS numbers (
-z) tell you which network each hop belongs to, which is how you know whether the problem is at your ISP, in a transit network or near the server.
Step 3 — Test in both directions
Internet routing is often asymmetric: packets from you to the server take one path, and the replies take another. A trace from your side only shows half of the picture. Run mtr from the VPS back to your public IP as well:
# On your computer: what is my public IP?
curl -4 https://ifconfig.me

# On the VPS: trace back to that address
mtr -rwbz -c 100 198.51.100.25
If the outbound trace is clean and the return trace shows loss from a certain hop, you have found the problem — and you have the evidence that proves it. When users in one region complain, ask one of them for an mtr (or a WinMTR export) to the server; it often shows the issue is between their ISP and a transit network.
Step 4 — curl: separate DNS, connection, TLS and the application
When "the site is slow", curl can show which phase takes the time. Run this from your computer:
curl -o /dev/null -s -w 'dns: %{time_namelookup}s\nconnect: %{time_connect}s\ntls: %{time_appconnect}s\nttfb: %{time_starttransfer}s\ntotal: %{time_total}s\n' https://example.com/Each value is the time from the start of the request until that phase finished:
| Phase grows | Likely cause | Where to look |
|---|---|---|
| dns | Slow or unreachable name servers | dig example.com, the "Query time" line; your DNS provider |
| connect (minus dns) | Network latency or loss, or a full connection queue on the server | ping and mtr from steps 1–3 |
| tls (minus connect) | Extra round trips, or a slow CPU doing the TLS handshake | Server load; TLS 1.3 and HTTP/2 enabled in the web server |
| ttfb (minus tls) | The application: PHP, database, no caching | Web server and PHP logs, slow query log |
Connect time is roughly one round trip, so it should be close to your ping average. If ping says 22 ms but connect regularly takes 1–3 seconds, packets are being lost and retransmitted, or the server is not accepting connections fast enough. Running the same curl command on the VPS itself against https://example.com/ (with --resolve example.com:443:127.0.0.1) removes the network entirely: if ttfb is still high, the network is not your problem.
Step 5 — iperf3: measure real throughput
Speed-test websites measure the path to their server, not to yours. iperf3 measures throughput between two machines you control. One side runs as server, the other as client.
On the VPS, open the port temporarily and start a one-off server:
# UFW (Ubuntu/Debian)
sudo ufw allow 5201/tcp

# firewalld (AlmaLinux)
sudo firewall-cmd --add-port=5201/tcp

# Serve a single test, then exit
iperf3 -s -1
On the other machine (your computer, or a second server):
# Upload: client → VPS, 10 seconds
iperf3 -c 203.0.113.10 -t 10

# Download: VPS → client (reverse mode)
iperf3 -c 203.0.113.10 -t 10 -R

# 4 parallel streams, to see if one TCP stream is the limit
iperf3 -c 203.0.113.10 -t 10 -P 4 -R
Start iperf3 -s -1 again before each test. When you are done, close the port with sudo ufw delete allow 5201/tcp (or sudo firewall-cmd --reload, since the firewalld rule above was not made permanent).
How to interpret the numbers:
- The slowest link wins. A test from home can never exceed your home connection — often 50–500 Mbit/s upload. Test from another well-connected server if you want to see what the VPS itself can do.
- One stream slow, four streams fast usually means high latency plus a little loss: a single TCP connection backs off. That is a path problem, not a bandwidth cap.
- "Retr" column high in the client output means many retransmissions — the same loss you should see in mtr.
- Upload and download very different points to asymmetric routing or a congested link in one direction; compare with the two-way mtr from step 3.
Step 6 — Check the server's own interface and firewall
Before you blame the path, make sure the VPS is not dropping packets itself:
# Errors and drops on the network interface (look at RX/TX errors and dropped)
ip -s link show

# Connection summary: thousands of connections in one state is a hint
ss -s

# Kernel messages about dropped traffic
sudo dmesg -T | grep -Ei 'conntrack|dropping|SYN flooding' | tail- "nf_conntrack: table full" — the firewall's connection tracking table is full and new connections are dropped. Find what opens so many connections, or raise
net.netfilter.nf_conntrack_max. - "possible SYN flooding" — the listen queue of a service is too small for the incoming connections, or you are receiving a flood.
- Strict rate limits in your firewall or fail2ban can look like random packet loss to the users they hit. If only some users have problems, check whether their IP is banned. Our fail2ban guide shows how.
Also check the MTU when large transfers hang but small requests work (typical with VPN tunnels): ping -M do -s 1472 203.0.113.10 sends a full 1500-byte packet that must not be fragmented. If it fails while -s 1200 works, something on the path has a smaller MTU.
What to send to support
At Liga Hosting the VPS is unmanaged — you administer the operating system — but the network up to your VPS is ours, and support does help with network issues. Frankfurt sits on a 40 Gbps network and Tulcea on a 10 Gbps network, both with DDoS protection in front of the VPS. A good ticket gets a quick answer. Include:
- the VPS IP and the public IP you test from;
- the exact times (with time zone) when the problem happened, and whether it is constant or intermittent;
- mtr reports in both directions (
mtr -rwbz -c 100), as text, not screenshots; - for throughput problems, the iperf3 output with and without
-R; - what you already ruled out: server load, firewall rules, the curl timings.
Problems that sit in your home ISP or a transit network far from the data centre cannot be fixed from the server side, but the mtr data shows who needs to be contacted.
Frequently Asked Questions
mtr shows 100% loss on one hop. Is my server down?
No, not if the hops after it and the destination show 0% loss. That router simply does not reply to probes, or limits its replies. Only loss that continues to the last hop affects your traffic.
Why is my VPS fast from one country and slow from another?
Each visitor's traffic takes a different route through different networks. A congested transit link or a long route on one of those paths affects only the users behind it. An mtr from an affected user, and one from the VPS back to them, shows where the delay starts.
Can I lower the ping to my VPS with a setting?
Not much. Latency mostly comes from distance and routing. You can stop it from getting worse, by avoiding loss, overload and a full connection table, and you can cut the number of round trips with HTTP/2, TLS 1.3, keep-alive and a CDN for static files. The fastest fix is to host close to your users.
Why does iperf3 show less than my connection speed?
The result is limited by the slowest part of the path, usually the home connection or Wi-Fi, and a single TCP stream slows down on long or lossy paths. Test with -P 4, test over a cable, and test from another server to see what the VPS itself can reach.
Is it safe to leave iperf3 running on my server?
It is better not to. An open iperf3 server lets anyone use your bandwidth for tests. Use iperf3 -s -1 for one test at a time and close port 5201 in the firewall afterwards.
At Liga Hosting, our Standard VPS and Performance VPS plans run on KVM with NVMe storage, a dedicated IPv4 address, DDoS protection and full root access, so you can run every test in this guide yourself. If your mtr points to the network near our data centre, contact us with the reports and we will look at it.